Excel Agent
Overview
Excel Agent is optimized for three types of work: viewing data, organizing data, and interpreting data. It is especially suitable for the following business scenarios:
- Data Analysis: Quickly understand table structures, extract key metrics, and summarize data trends.
- Report Organization: Clean duplicate, missing or inconsistently formatted data to unify table content.
- Formula Assistance: Generate or interpret formulas based on business goals and help troubleshoot formula errors.
- Business Reporting: Convert detailed data into conclusions, key changes and recommended follow-up actions.
- Multilingual Processing: Translate headers, field values or business descriptions to facilitate cross-team collaboration.
Excel Agent provides 5 core capabilities:
- Analyze: Summarize key data and trends within a selected range or the active worksheet.
- Formula: Generate, interpret and optimize formulas from natural language requirements.
- Organize: Identify duplicates, missing values, abnormal formats and inconsistent field content.
- Translate: Translate selected cells, headers or business notes.
- Optimize: Refine analysis outputs into summaries, bullet points, table explanations or report outlines.
If you are unfamiliar with the table structure, start with Analyze. Use Formula, Organize or Translate when your processing objective is clear.
Prerequisites
Verify the following before use:
- The target workbook is opened in Excel.
- Office Agent permissions have been enabled and you have logged in successfully.
- The workbook and target worksheet are editable, without read-only, protection or permission restrictions.
- For targeted data processing, select the target range first. Leave the range unselected to analyze the entire worksheet.
- Save the workbook before processing formulas, amounts, dates or critical business metrics.
Operation Steps
1. Launch Excel Agent
When to use: Prepare to analyze data, organize tables or handle formulas.
Procedure:
- Open the Excel workbook and click the Office Agent entry at the top-right corner.
- Confirm the active worksheet and target data range.
- Select Analyze, Formula, Organize, Translate or Optimize based on your task.
Notes:
- Outputs will be more relevant when the data scope is clearly defined.
- If data cannot be read or written, check whether worksheet protection is enabled and whether your account has edit permissions.
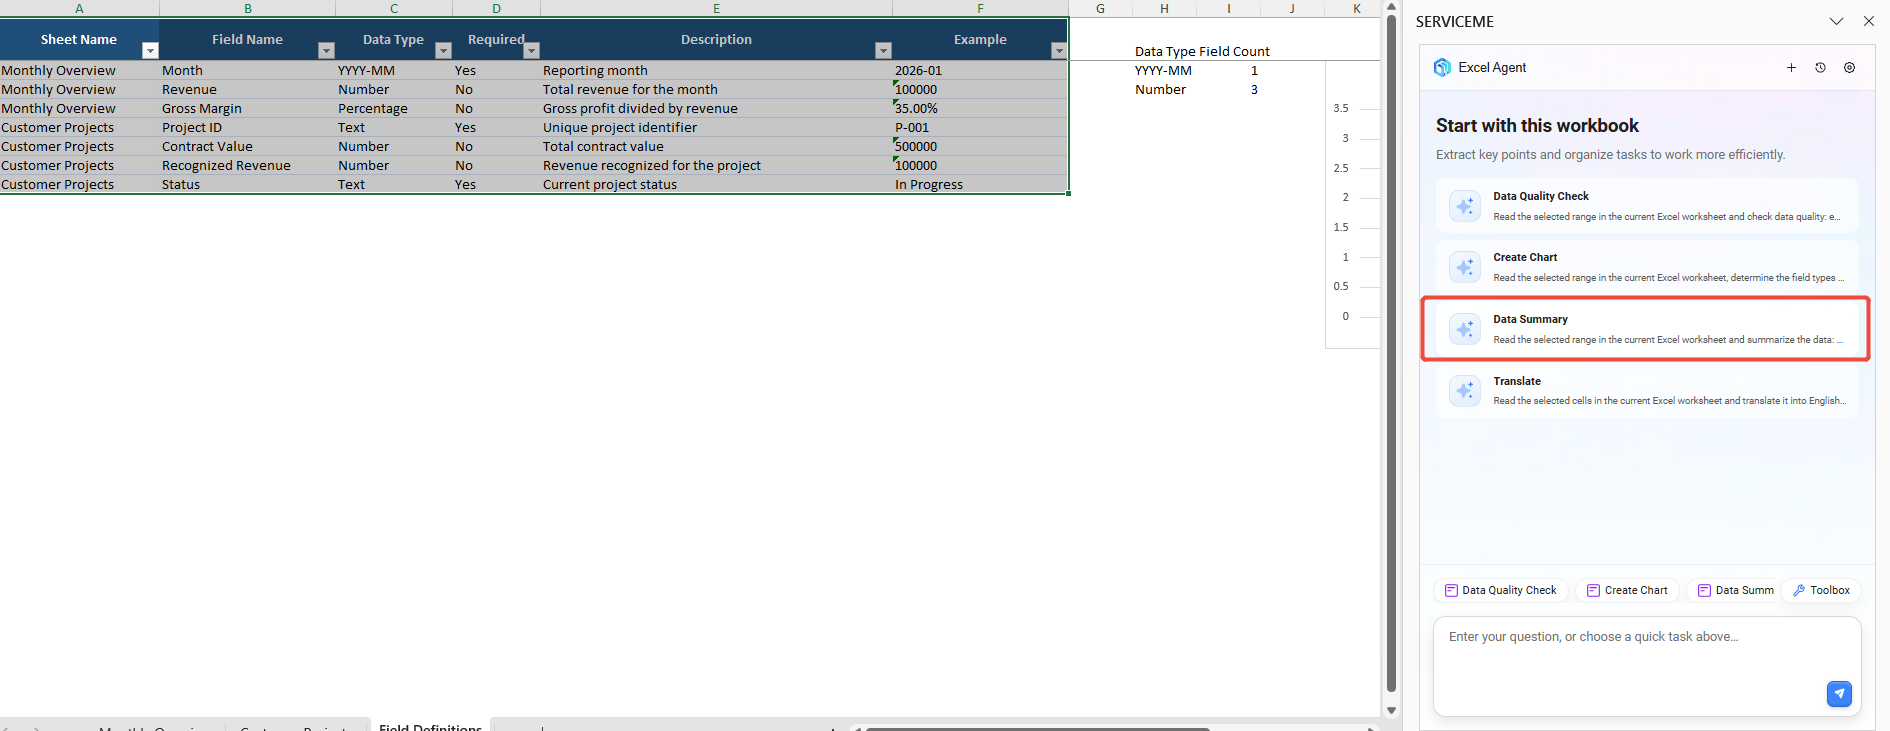
1. Data Summary
When to use: Quickly understand table structures, field grouping and data patterns to get an overview of the dataset.
Procedure:
- Select the target data range within the worksheet.
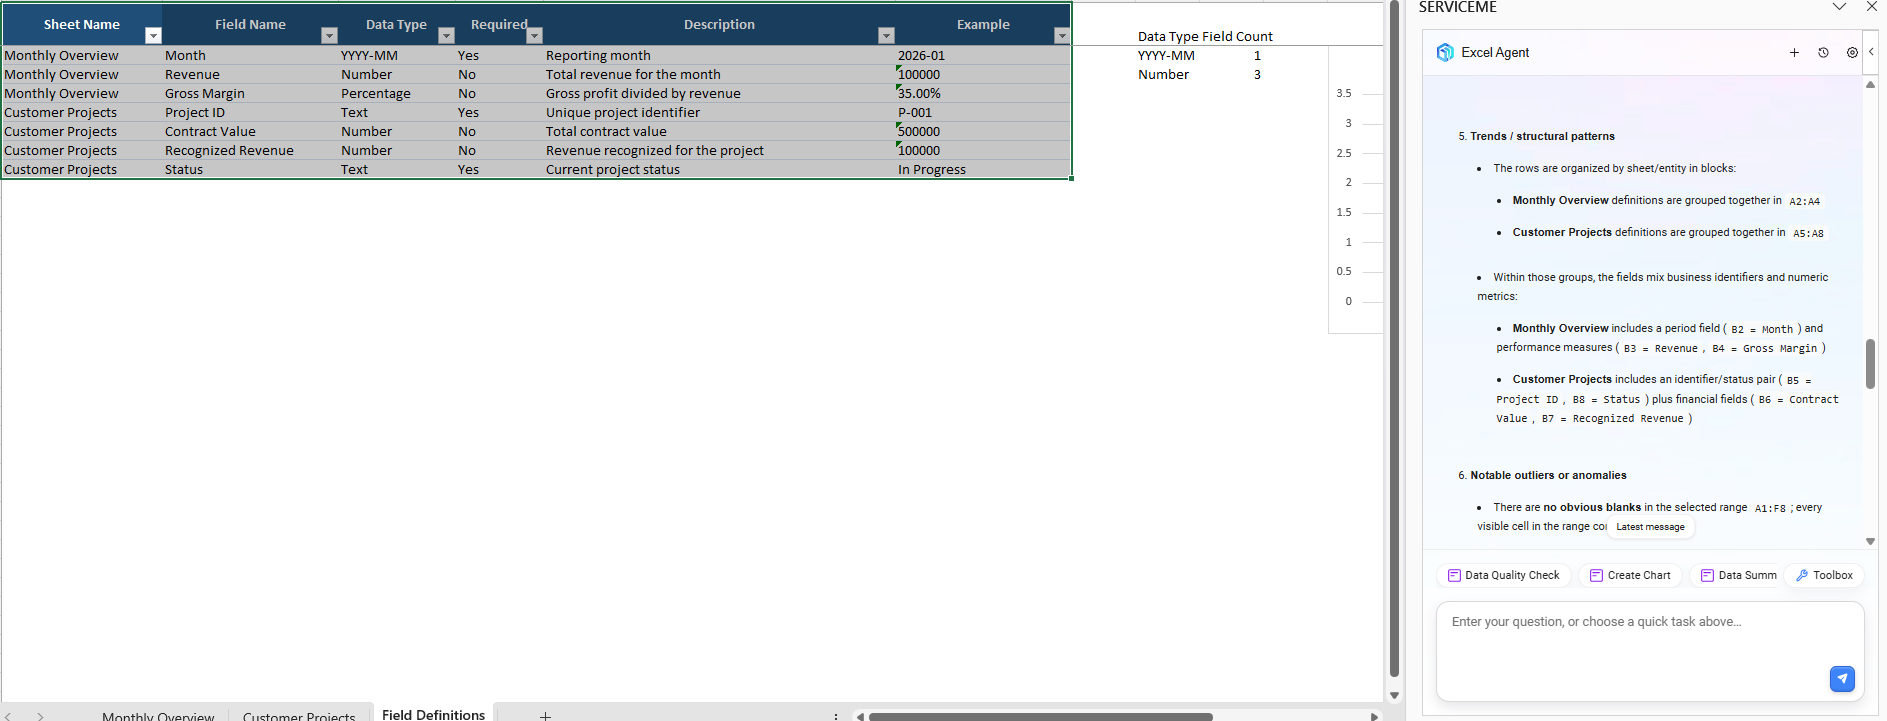
- Click Data Summary. Agent reads the selected cell range and automatically aggregates data.
- Review outputs: table structure grouping, field types, business definitions and data distribution patterns.
- Identify data patterns, structural divisions and check for obvious blanks or anomalies.
- Extract key information for documentation and report preparation as needed.
Notes:
- Fields are grouped by Sheet / entity to distinguish business identifier fields from numeric metrics.
- The selected range is automatically scanned for blank cells and obvious outliers.
2. Create Chart
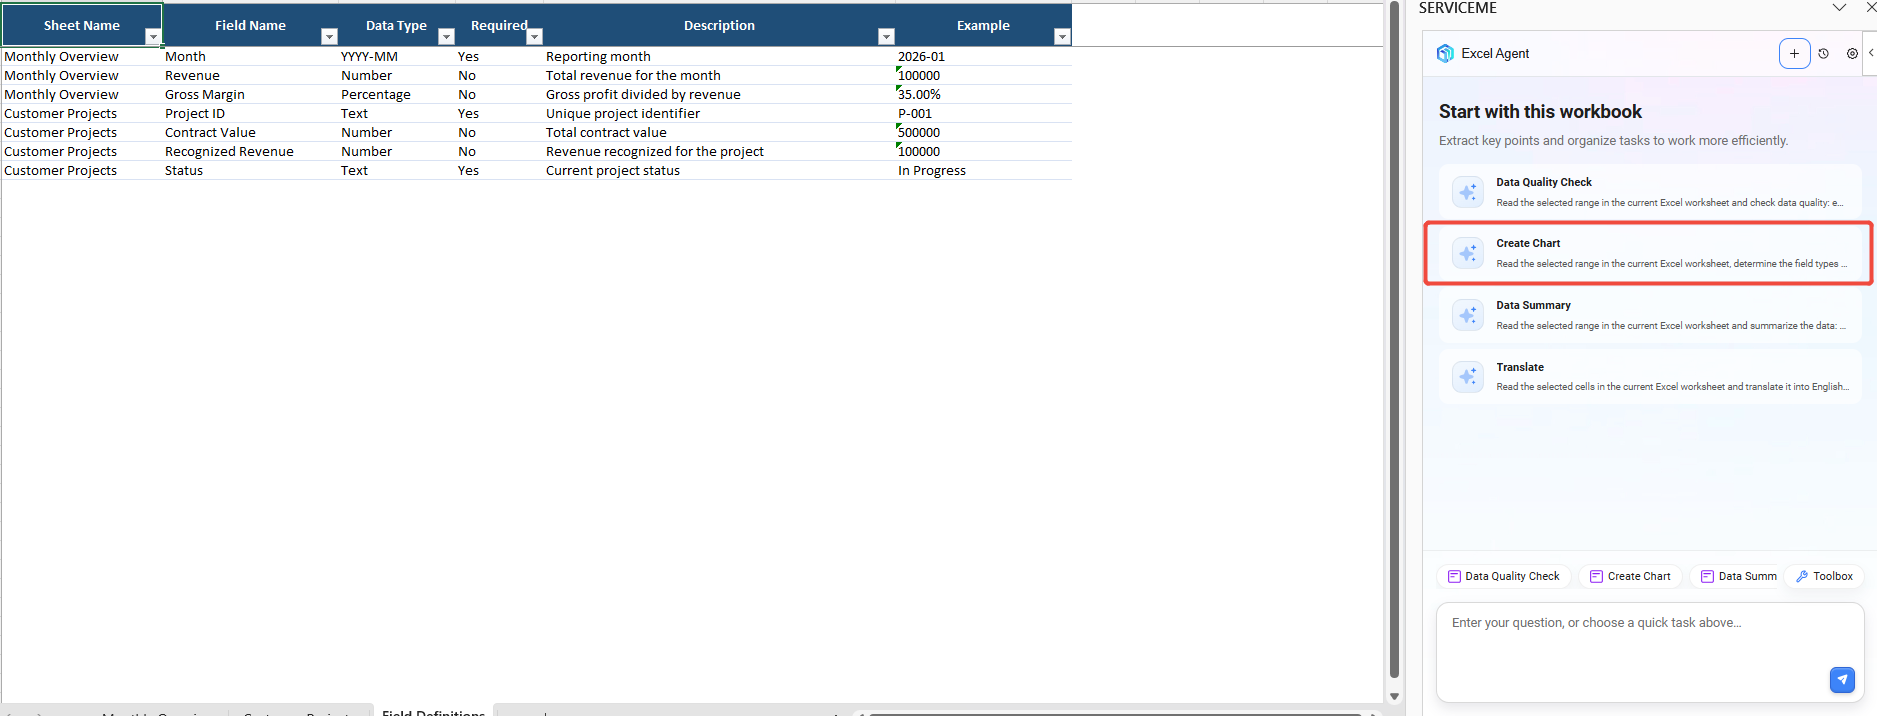
When to use: Generate visualizations quickly based on table metadata and statistical metrics.
Procedure:
- Select the target data range.
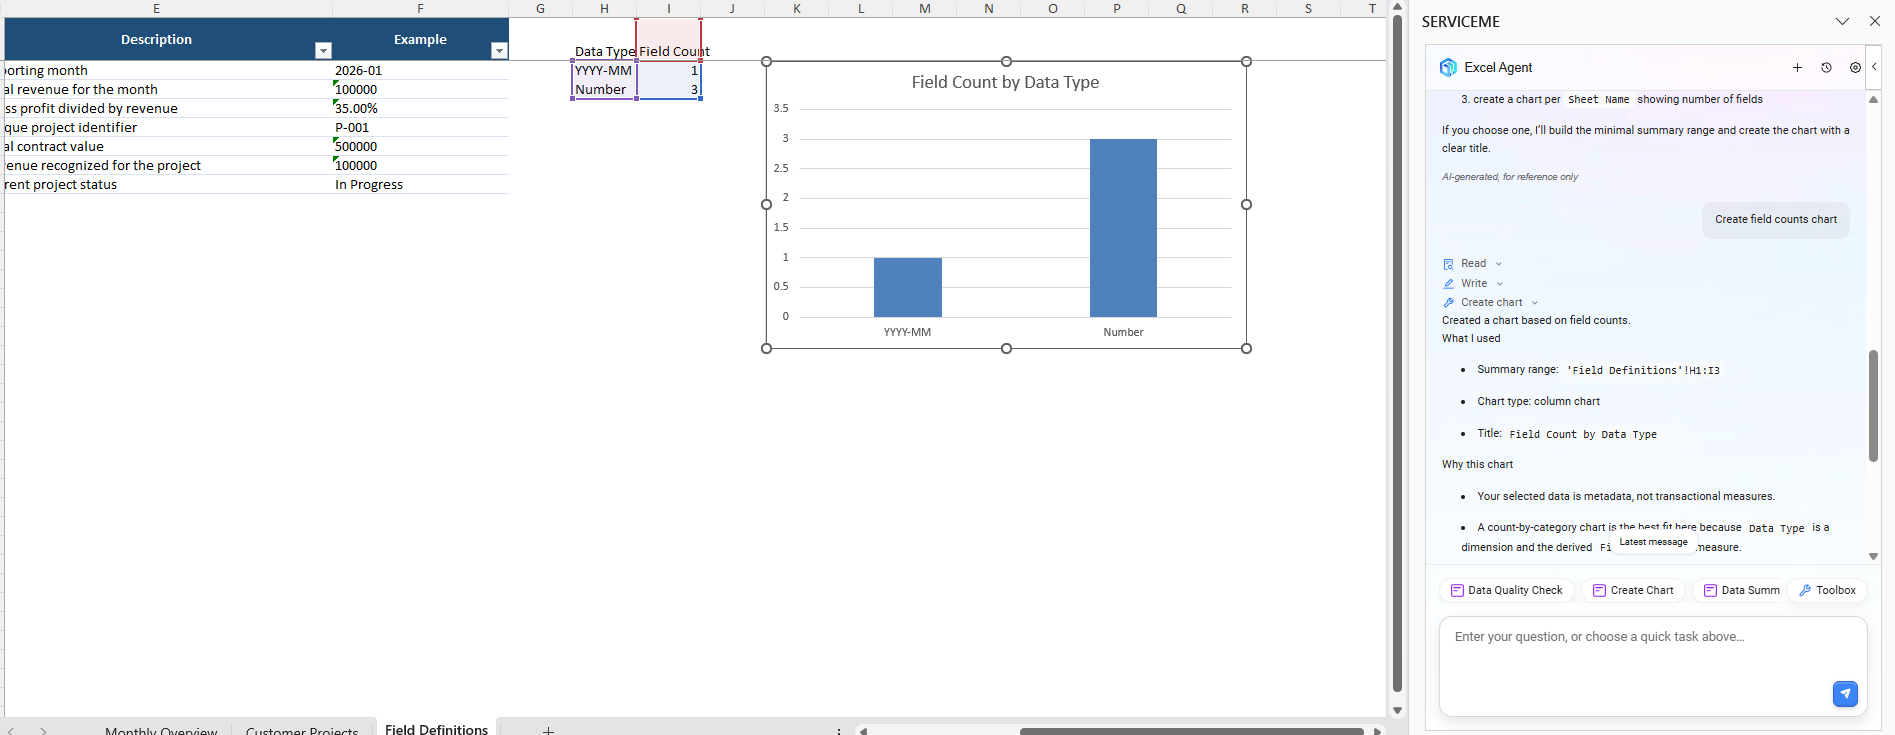
- Click Create Chart. Agent automatically detects field types and generates supporting aggregated data.
- Automatically selects a suitable chart type (e.g. column chart) and sets the chart title.
- Inserts the chart directly into the Excel worksheet.
- Verify the chart data source and statistical logic to confirm visualization meets business requirements.
Notes:
- Metadata tables are suitable for category count charts, such as counting fields by data type.
- Agent explains chart selection rationale and the data range used.
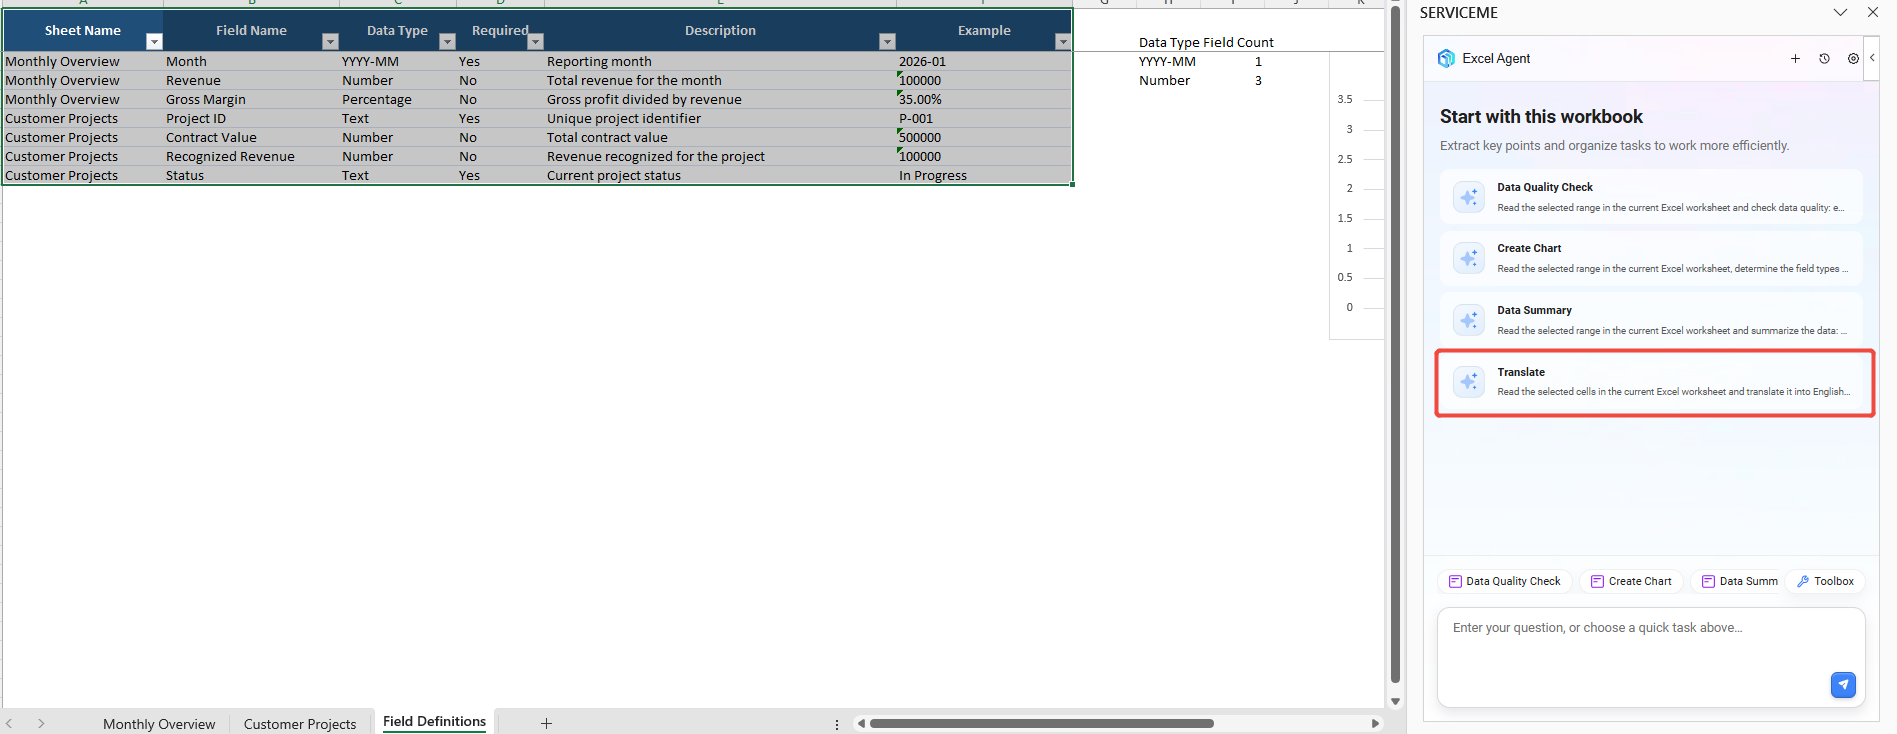
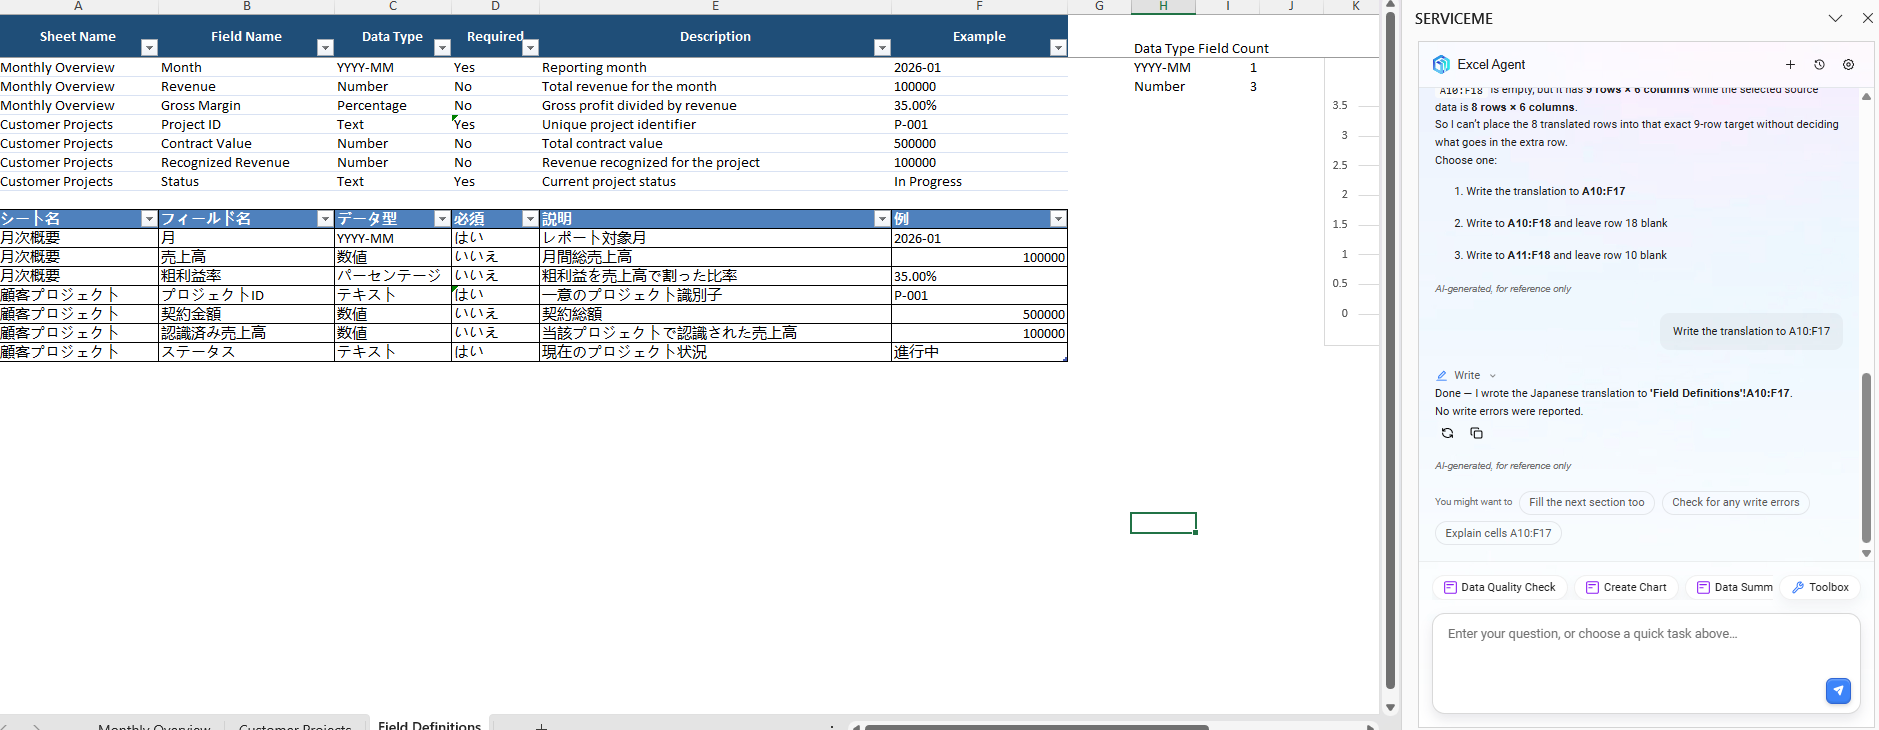
3. Table Translation
When to use: Produce multilingual versions of Excel metadata tables and field definition documents.
Procedure:
- Select the cell range to translate (headers + data rows).
- Click Translate, then set source and target languages.
- Specify the destination cell range and confirm row alignment rules.
- Agent writes translated content to the specified area while preserving the original table structure.
- Validate accuracy of business terms, field vocabulary and status enumeration values.
Notes:
- Supports batch translation of full-table field definitions while retaining row and column layout.
- Reserve blank space before translation to avoid overwriting original English data.
4. Data Quality Check
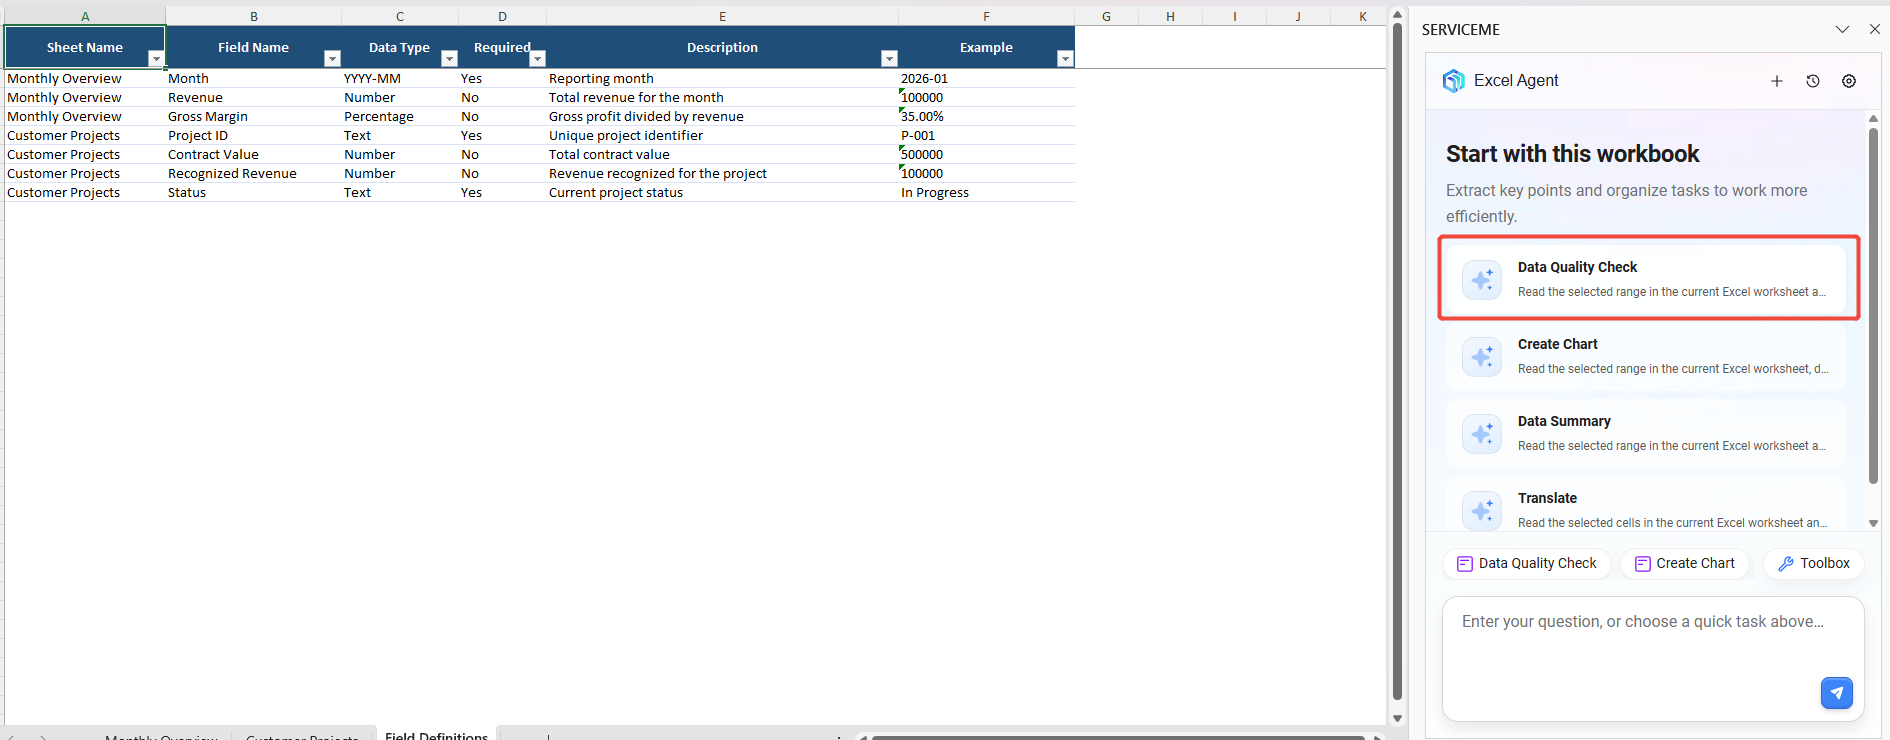
When to use: Validate data completeness and format consistency to identify dirty data.
Procedure:
- Select the data range to validate.
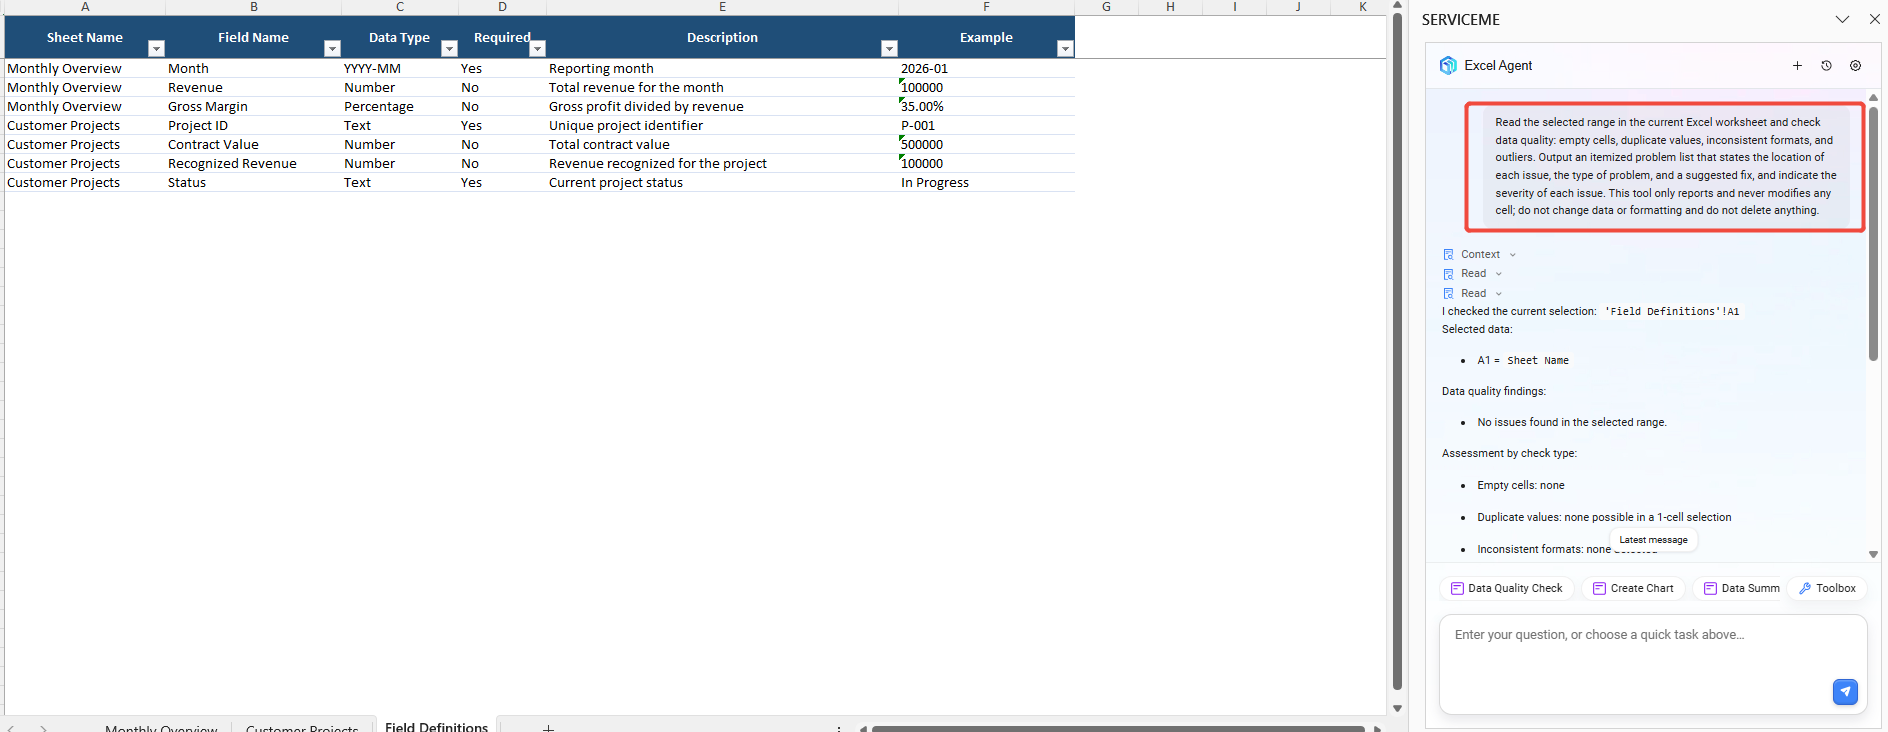
- Click Data Quality Check. Agent reads the selected cells.
- Automatically scans for blank cells, duplicates, inconsistent formats and outlier values.
- Outputs a structured inspection report: issue location, issue type, remediation suggestions and severity level.
- Manually review based on the report and correct data as required.
Notes:
- Only generates inspection reports; no cells will be modified or deleted automatically.
- Statistics are categorized by issue type: blank cells, duplicates, format anomalies, etc.
Recommended Workflows
Choose the path matching your data task:
- Explore business dataset: Analyze -> Review key figures -> Optimize into report talking points.
- Add calculated fields: Define calculation objective -> Generate formula -> Validate with known results -> Apply in bulk.
- Clean business details: Duplicate source worksheet -> Organize data -> Spot-check abnormal records -> Save results.
- Build multilingual reports: Translate headers and descriptions -> Validate terminology and units -> Optimize summaries and conclusions.
If time is limited, at minimum complete analysis result review and key data spot-check before using outputs for formal reporting or business decisions.
Scope & Limitations
- Analysis, formulas and organization suggestions generated by Excel Agent are auxiliary outputs and cannot replace financial, compliance or business reviews.
- Handling of complex PivotTables, external data connections, macros, VBA and protected worksheets may be limited by the Excel host environment.
- Images, charts and complex objects may not be fully readable; prioritize editable cell ranges.
- Process large tables or multi-sheet workbooks in segments by worksheet to avoid excessive context load.
- Keep a copy of raw data before bulk deletion, overwrite, fill or format conversion, and confirm processing scope.
- Comply with organizational data security and access policies when working with personal identifiable information, financial records or other sensitive content.
Frequently Asked Questions
1. Why do analysis figures not match values in the table?
Check the selected range, hidden rows/columns, filter conditions and metric definitions. Confirm whether totals, duplicate records or blanks are included. Narrow the range and re-analyze if needed.
2. Why cannot generated formulas work directly?
Field positions, sheet names, ranges or data types may not be fully specified. Add explicit cell references and test formulas on a small subset first.
3. Will organizing data overwrite original content?
Overwrite behavior depends on the operation and Excel host capabilities. Duplicate the original worksheet or save a separate version before bulk operations, and verify outputs incrementally.
4. Why cannot selected content be read?
Common causes: read-only or protected mode, or selection of images, charts, merged cells and other complex objects. Switch to editable state and select a contiguous cell range.
5. Can analysis outputs be used directly in formal reports?
Direct use is not recommended. For amounts, business KPIs, external-facing data or management decisions, business owners must review data sources, calculation logic and conclusions.
Value
- Reduce time spent on table analysis, formula writing and repetitive data cleanup.
- Help users discover data trends, anomalies and field issues faster.
- Improve efficiency for multilingual reports and business documentation.
- Enable data analysis, table preparation and report drafting within one workflow.