BI Analysis Based on Data
Intelligent Analysis and Chart Generation
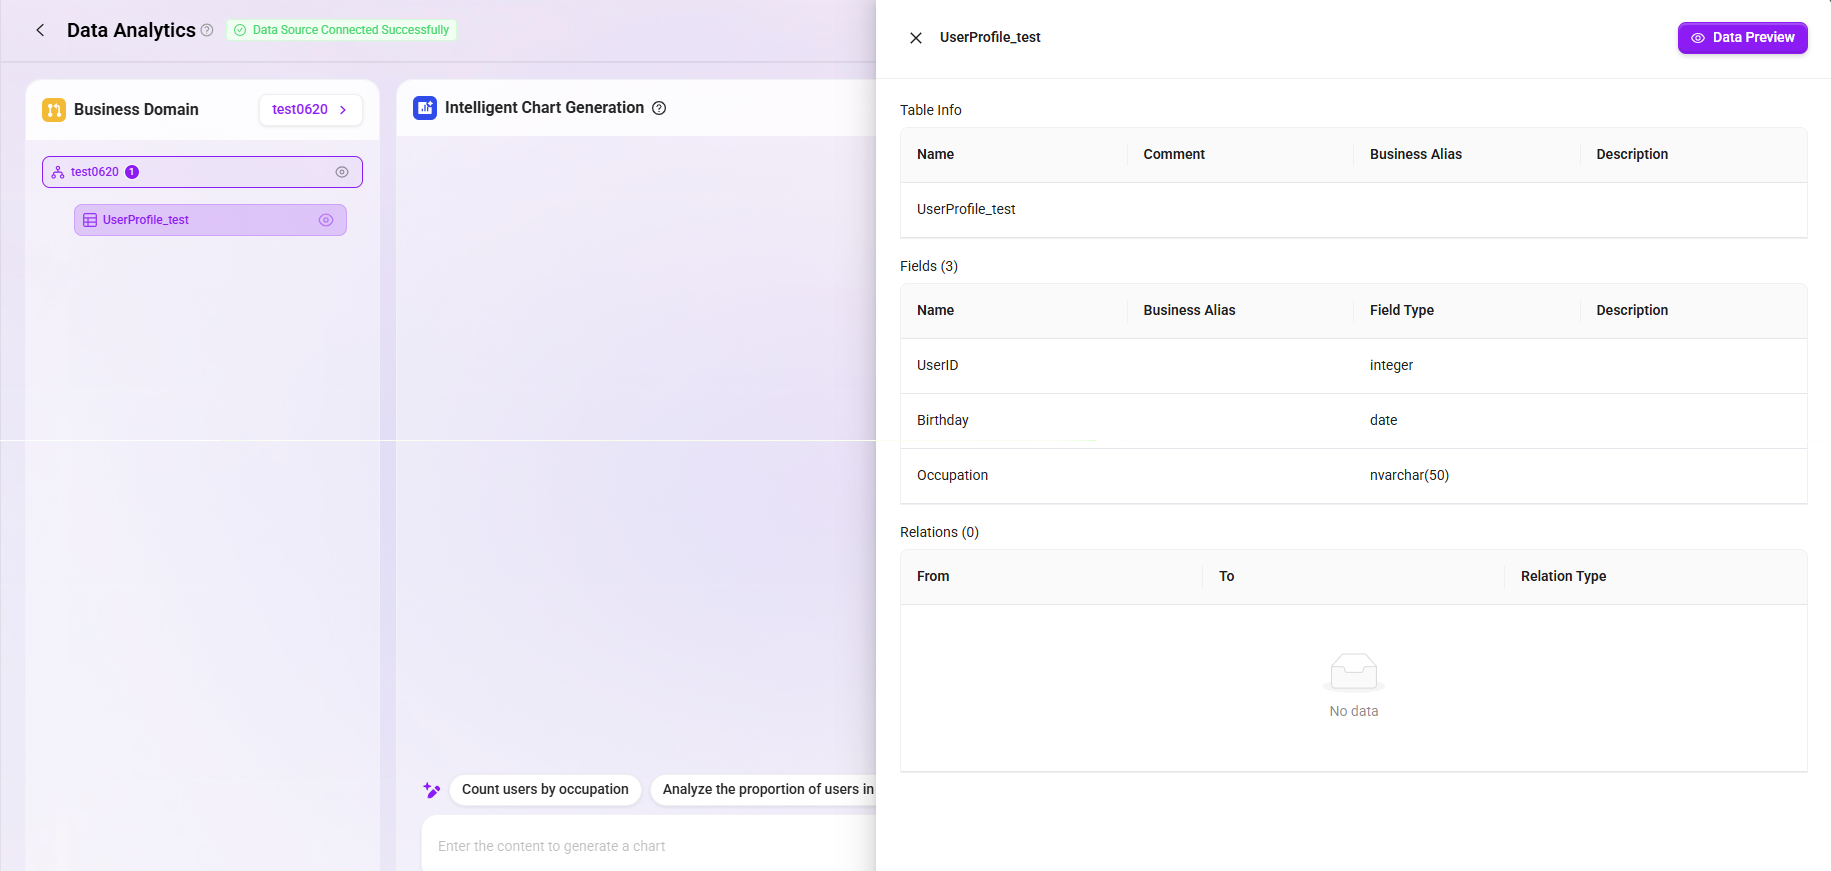
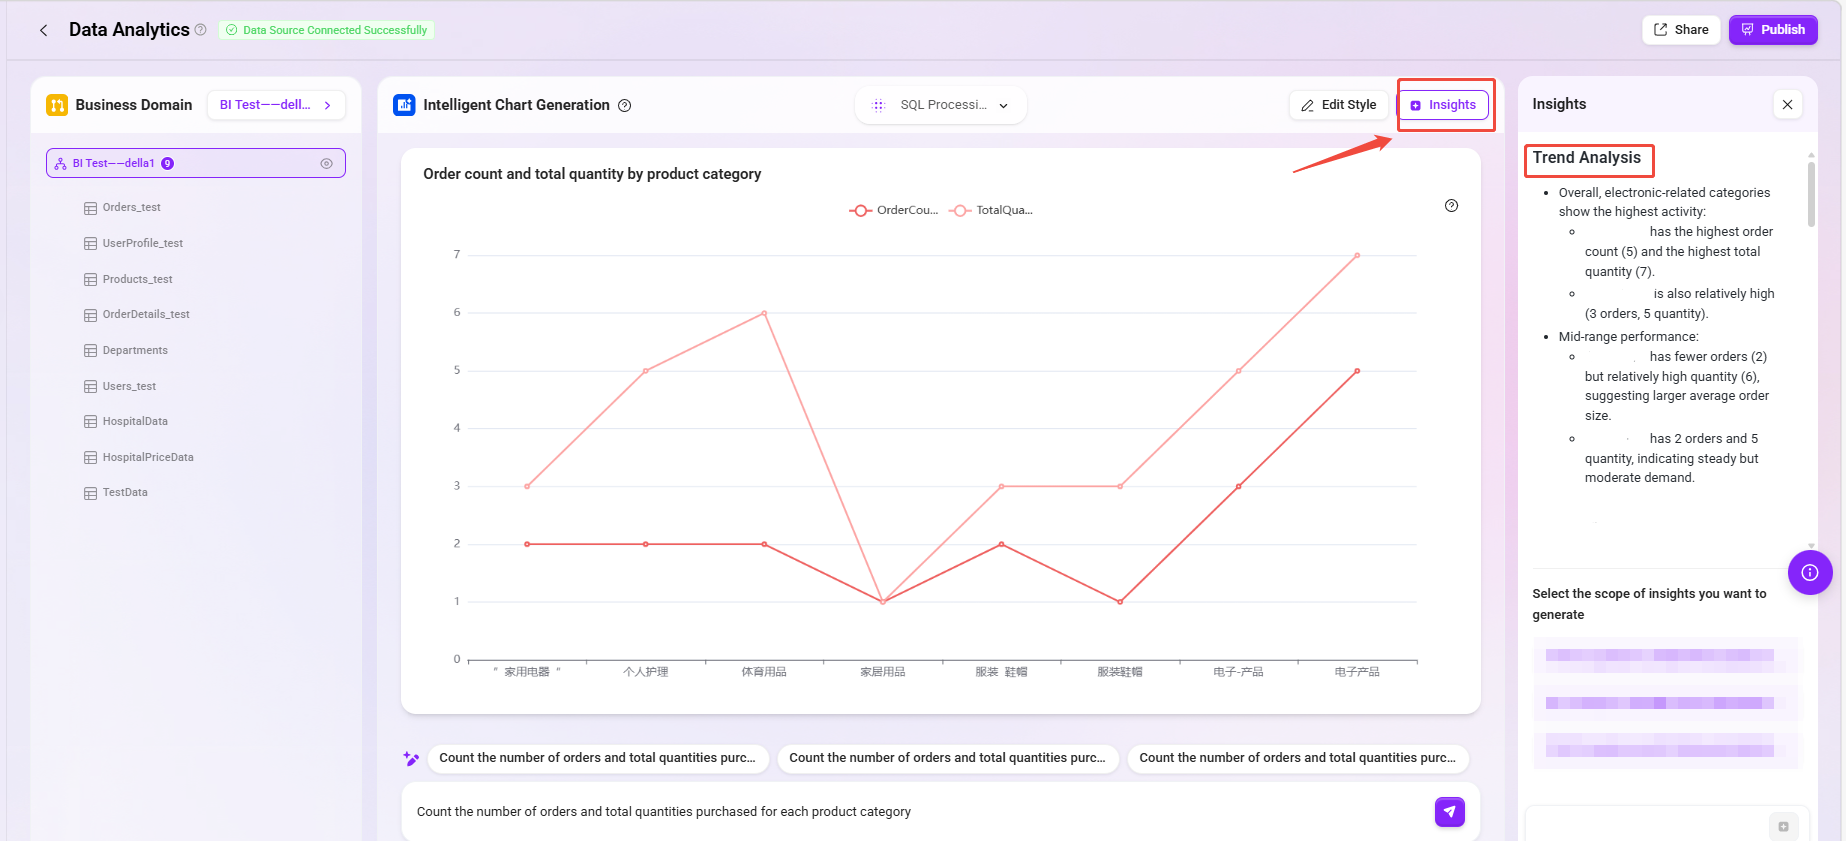
After the business domain is built, users can perform visual analysis in the "Intelligent BI" module.
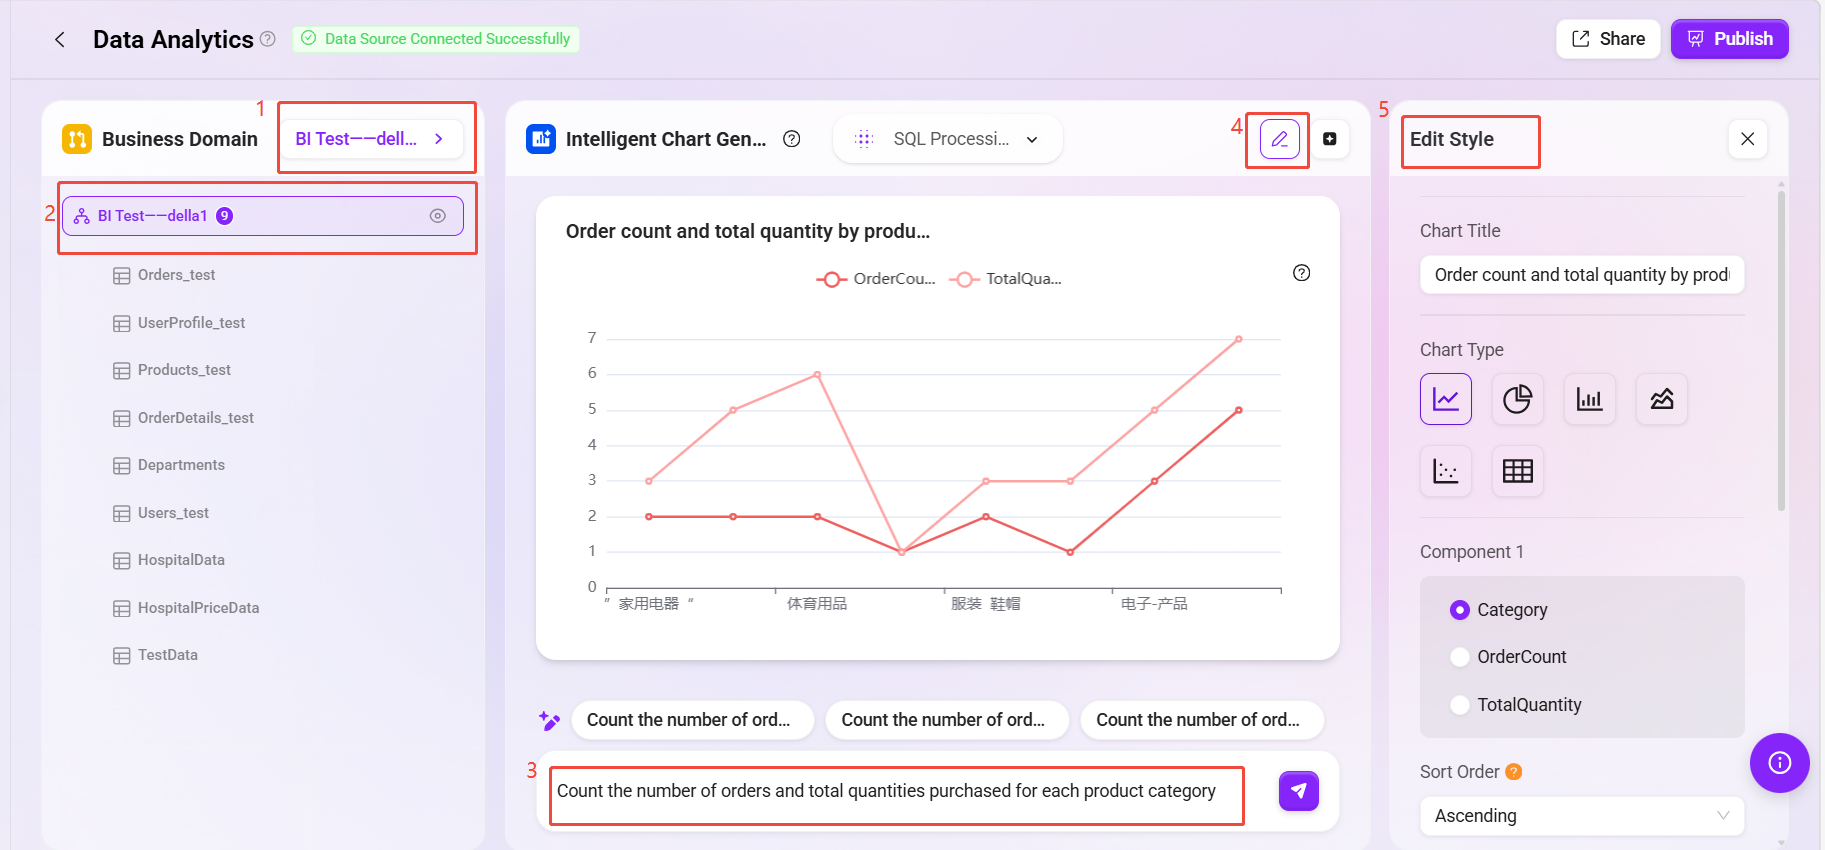
1. Select a Business Domain
- After entering Intelligent BI, select a pre-built business domain;
- The data tables under this domain will be displayed on the left;
- Supports data table preview, including field names and sample data.
2. Intelligent Chart Generation
- Enter chart requirements in the input box, supporting natural language queries, such as:
- "Sales trend in the past 7 days"
- "Order volume grouped by region"
- The system automatically converts the request into an SQL query based on semantic recognition and generates the corresponding chart;
- Supports multiple chart types such as bar charts, line charts, and scatter plots;
- Optimizes user input and provides suggested completions, making it especially suitable for business users without technical knowledge;
- Charts support editing, including title, chart type, X/Y axis settings, color style, etc.
3. Data Insight Analysis
- On the right side of the BI interface, click "Insights";
- The system automatically analyzes data trends, anomalies, and possible causes through AI;
- Helps users quickly identify key business issues and supports business decision-making.
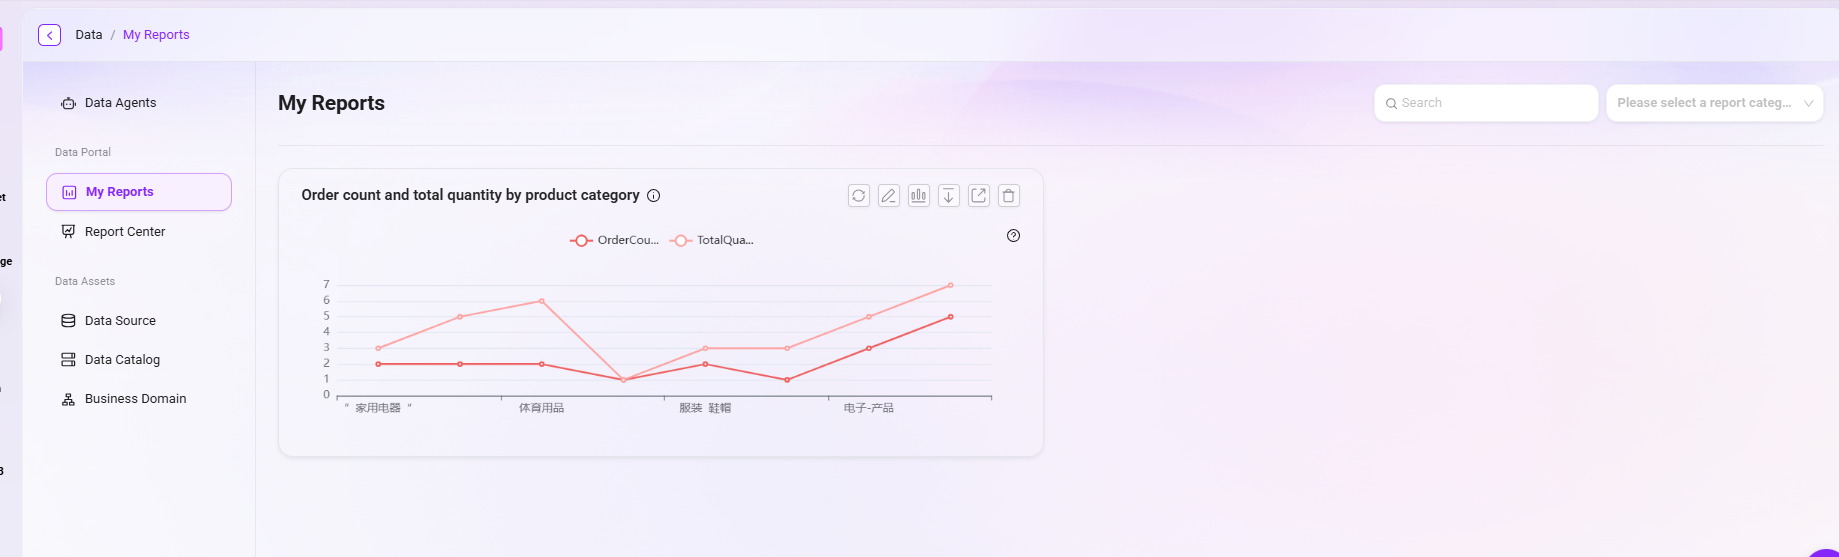
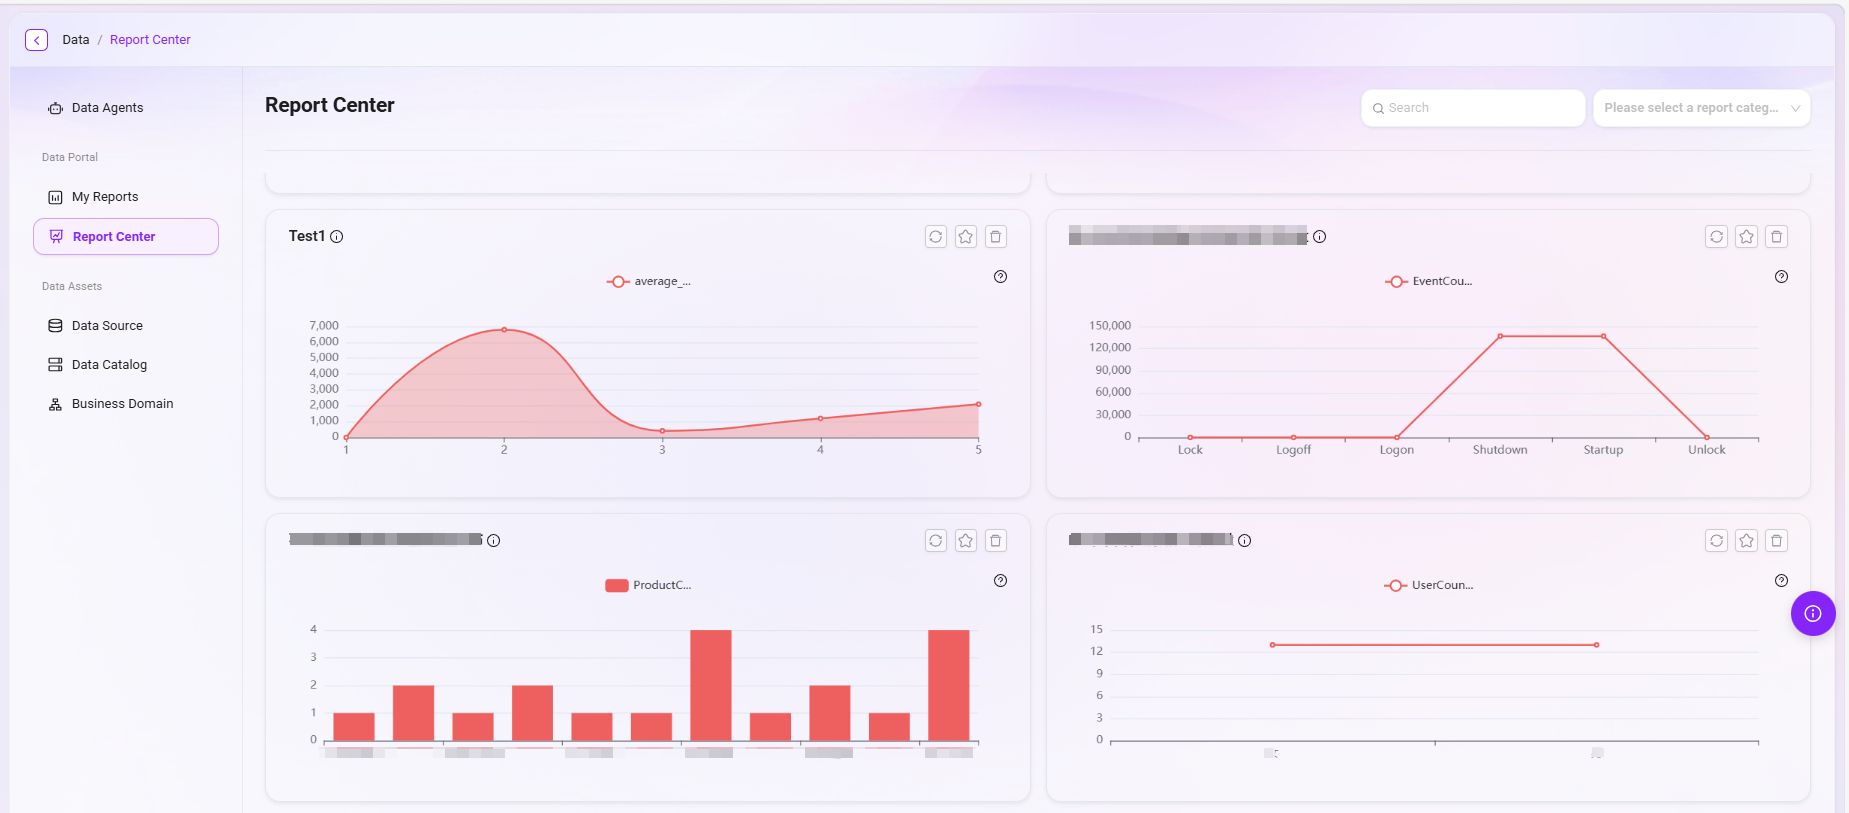
My Analysis & Analysis Center
Analysis Publishing and Sharing
After analysis adjustments are completed, the analysis can be published and shared.
1. Analysis Publishing
- Supports publishing analysis to:
- My Analysis (visible only to the individual);
- Analysis Center (shared within the organization);
- Supports selecting an analysis category when publishing.

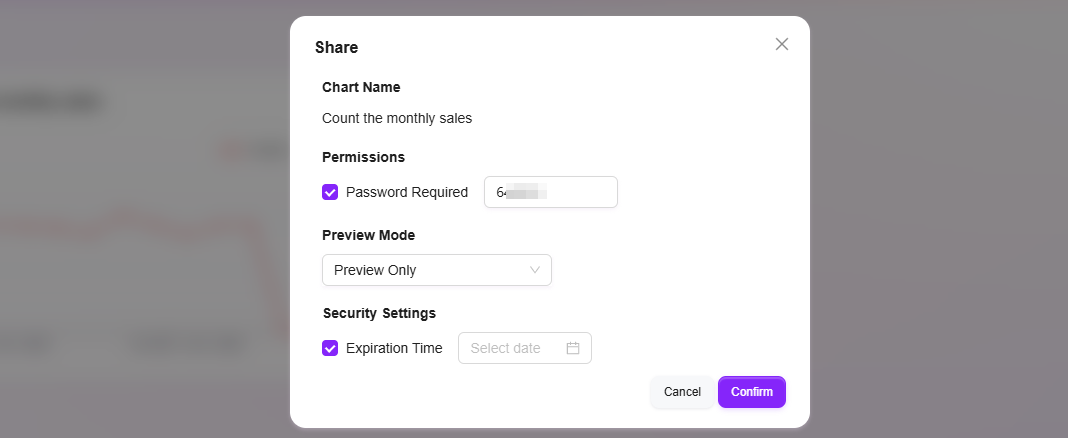
2. Analysis Sharing
- Supports setting:
- Whether to enable password protection;
- Access permissions (preview only);
- Expiration time limit;
- Can be quickly shared with others via a link.
3. Analysis Management
- In "My Analysis", published analyses can be edited, renamed, shared, downloaded, or deleted;
- "Analysis Center" provides a global summary of analyses and supports category-based viewing and favorites.