Monitoring
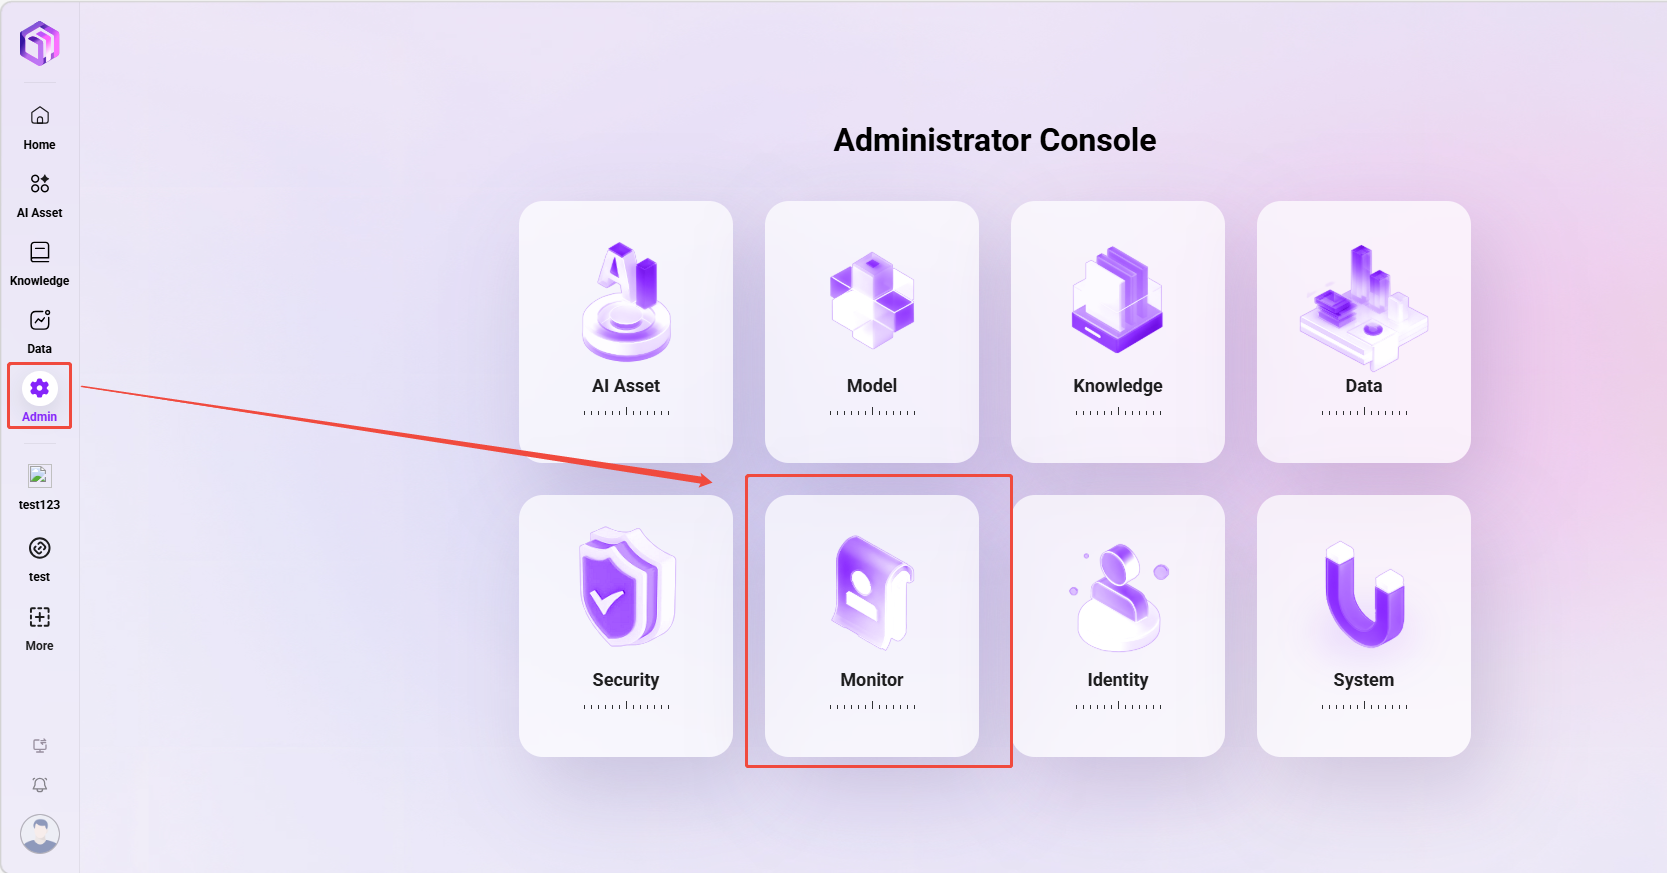
The entry point for monitoring is shown below:
Statistics
Agent Monitoring
The data center provides comprehensive statistics and analysis on agent usage and user conversation content, helping users better understand AI usage effectiveness and operational status, and optimize management and decision-making.
The data center supports data statistics by agent dimension, system API dimension, and time dimension.
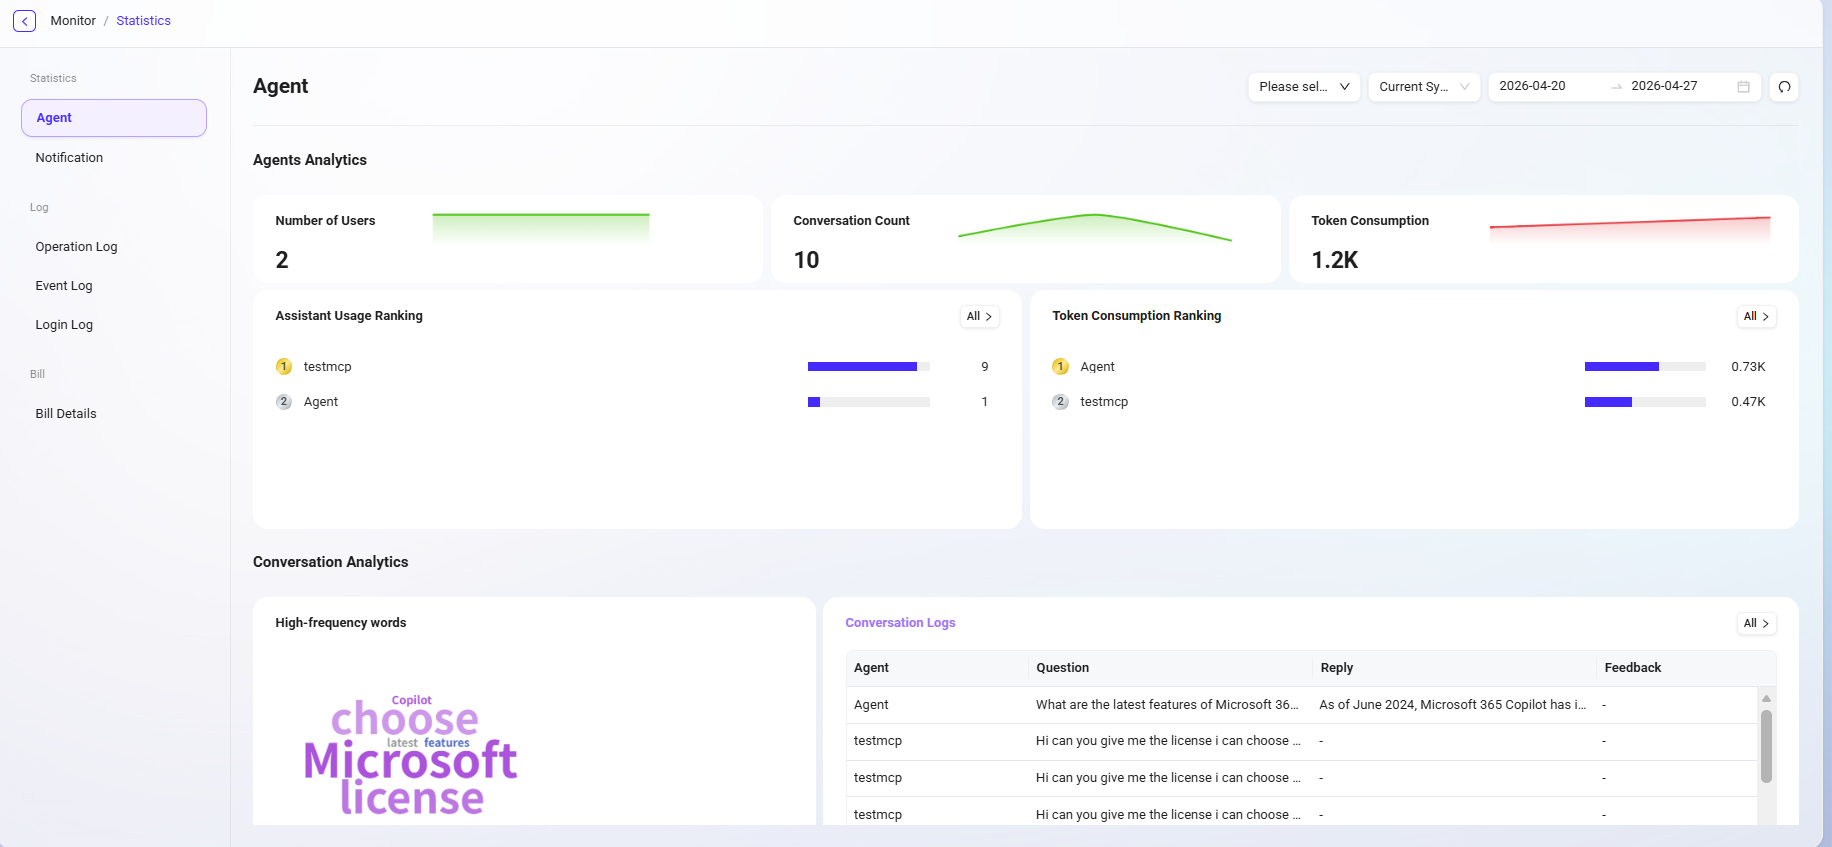
Agent Analysis
This section focuses on quantitative analysis of the usage of each agent, including:
- Number of conversation users: The number of unique users who have interacted with the agent.
- Number of conversations: The total number of interactions between users and the agent, measuring usage activity.
- Token consumption: Measures the resource consumption of model calls during agent operation.
- Agent usage ranking: Ranks all agents by usage frequency to identify high-frequency agents.
- Token consumption ranking: Counts Token usage for each agent to assist with resource optimization and cost control.
Conversation Analysis
This section deeply explores the conversation content between users and agents to gain insights into user needs and interaction patterns, including:
- High-frequency vocabulary analysis: Extracts keywords from user conversations to identify focus hotspots and demand trends.
- Conversation logs: View historical conversation details for quality traceability, issue troubleshooting, and content review.
💡 Tip: Conversation count statistics and agent usage rankings are updated once per day; other information such as conversation logs is updated in real time.
Notification Management
Notification management is used to count and view various notification messages received by all users in the system. Through this feature, administrators can track notification delivery, understand whether users have read them, and whether the notification content has been effectively conveyed.
For example: when a user gives feedback on an agent's response during a conversation, the system sends a feedback notification to that user. Such notifications will be recorded and displayed in notification management.
Feature Description
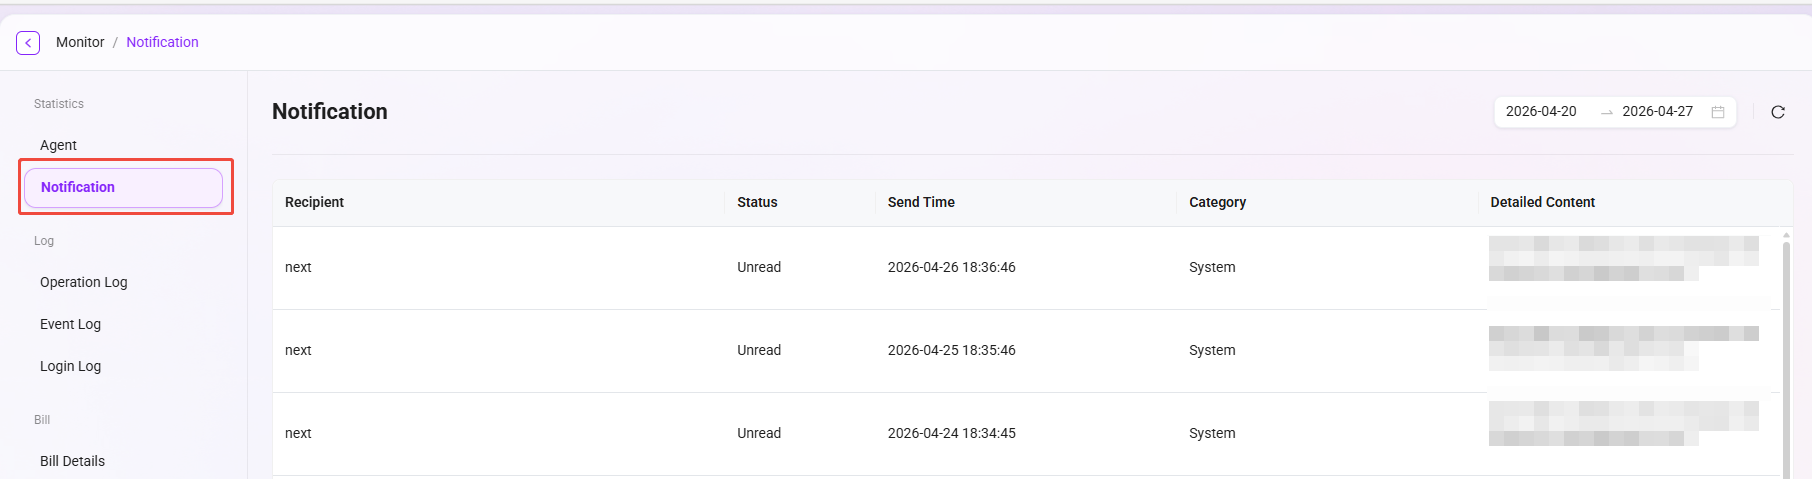
On the notification management page, the following information can be viewed:
- Recipient: The user account or username that received the notification.
- Notification status: Whether the current notification has been read (read / unread).
- Sent time: The specific time when the system sent the notification.
- Notification content: Detailed notification information, including the original prompt, feedback result, etc.
- Notification category: The category to which the notification belongs, such as feedback notifications, system notifications, task reminders, etc.
💡 Tip: Notifications can be filtered by time dimension.
System Logs
This system provides comprehensive log recording and analysis capabilities, covering three core log types: operation logs, event logs, and login logs, helping you achieve system behavior tracking, security auditing, and exception troubleshooting.
💡 Tip: The log retrieval range has been extended to 1 year, making it easier for users to conduct audits and analysis over longer time spans.
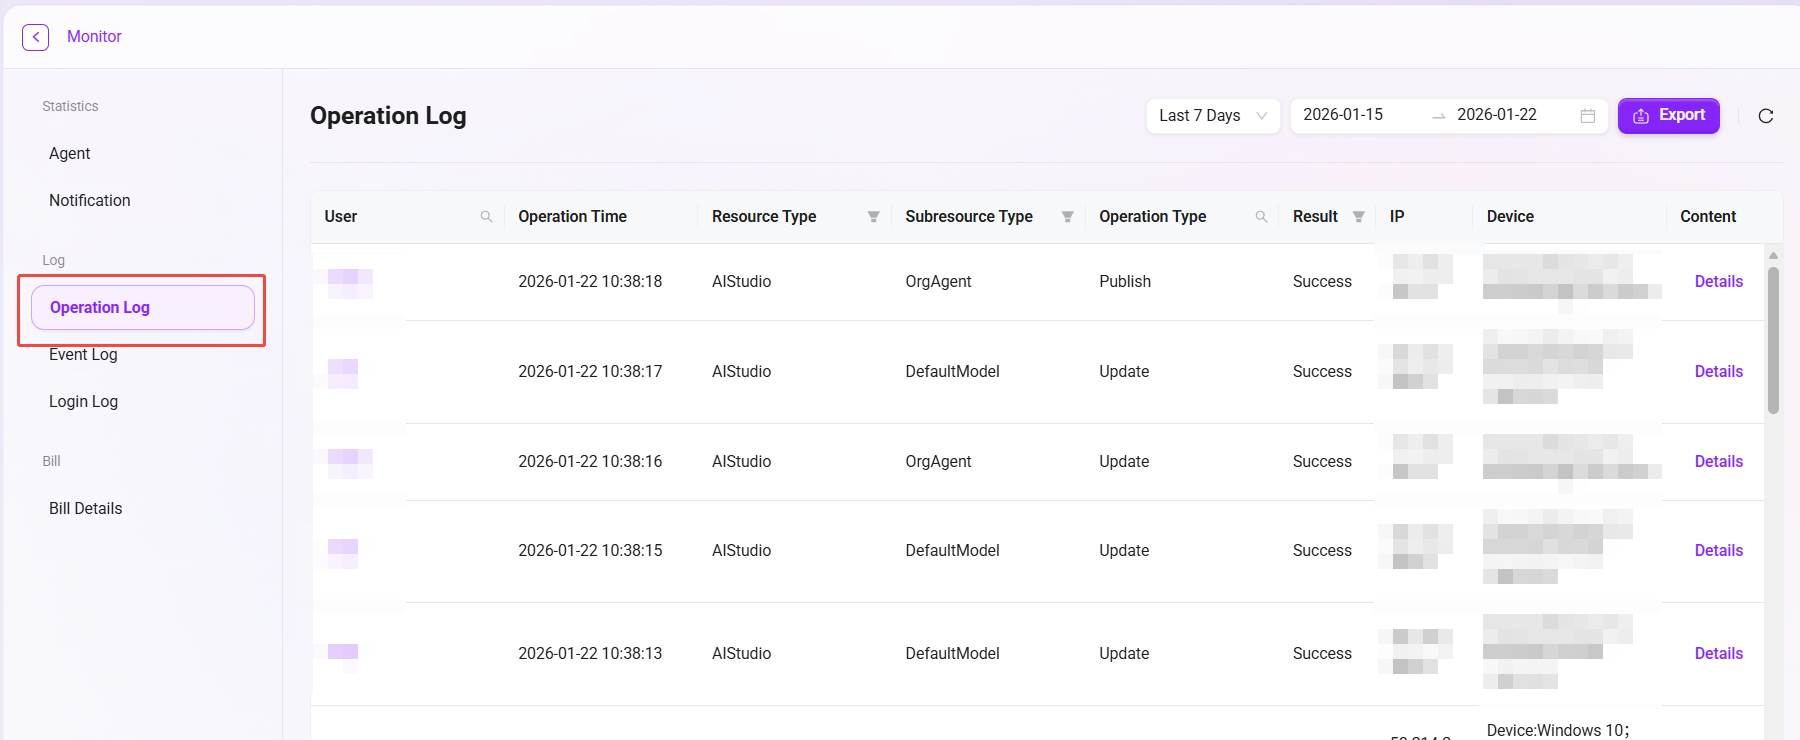
Operation Logs
- Operation logs are used to record key operational behaviors of all users in the system, helping administrators track the change history of resources, audit system usage, and troubleshoot potential issues.
- The system automatically captures every operation such as resource creation, update, publication, or deletion, ensuring traceability and security of operations.
- To further improve the auditability of knowledge base management, operation logs have now enhanced recording of knowledge base-related resources, including operations on Workspace, File, QnA, and more.
Field Description
| Field Name | Description |
|---|---|
| Username | The name of the user account performing the operation |
| Operation time | The specific timestamp when the operation occurred, used for auditing and time sorting |
| Resource type | The resource category of the operated object, such as knowledge base, data, AIStudio |
| Sub-resource type | The sub-resource involved in the operation, such as QnA, personal/enterprise space, personal/organizational agent |
| Operation type | Indicates the source type of the operation, such as Update, Publish, UPLOAD, CONFIG_INDEX, RESEGMENT |
| Operation result | Indicates the result of this operation, Success or Failed |
| Operation IP address | The IP address of the user when performing the operation |
| Operation device information | The device type and browser used by the user |
| Operation content | Detailed operation details in JSON format, including request and response information |
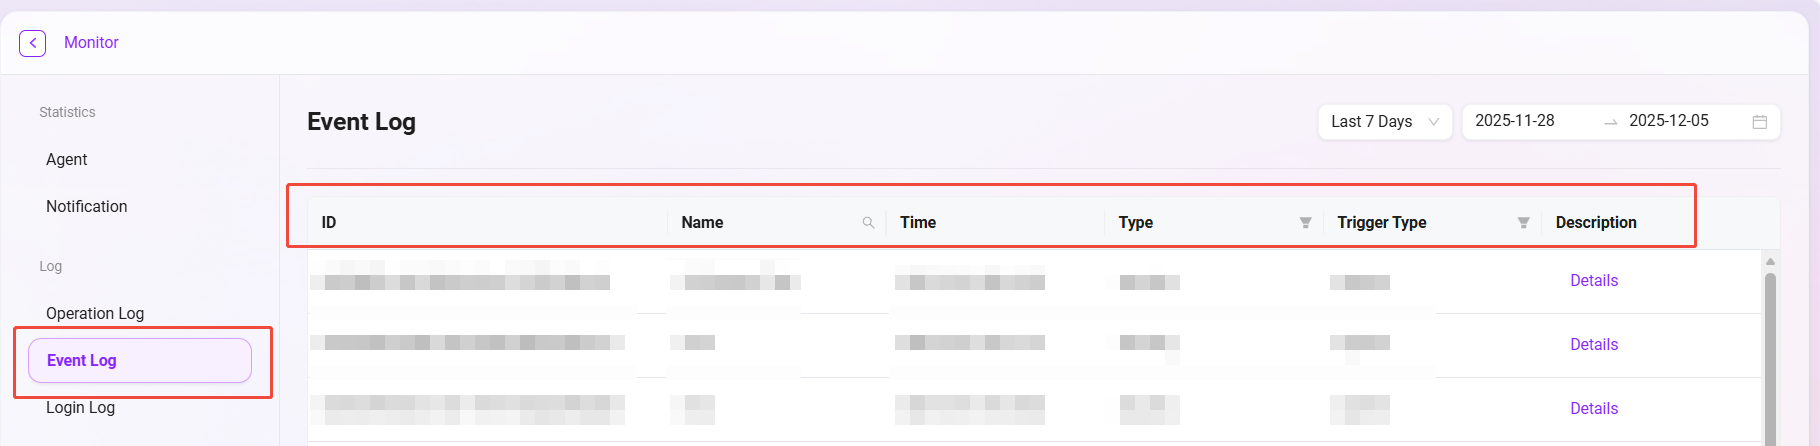
Event Logs
Event logs are used to record various important events generated during the internal operation of the system, such as scheduled task execution, status changes, error alerts, etc. They are an important tool for monitoring system health and troubleshooting internal issues.
Field Description
| Field Name | Field Function |
|---|---|
| ID | A unique identifier automatically generated by the system to distinguish each event record |
| Event name | A brief description of the event content for quick understanding of the event nature |
| Time | The specific timestamp when the event occurred, used for time sorting and analysis |
| Event type | Identifies the event category (security, system, application), supporting category filtering |
| Trigger type | Records whether the event trigger type is system or api |
| Event description | Detailed operation details in JSON format |
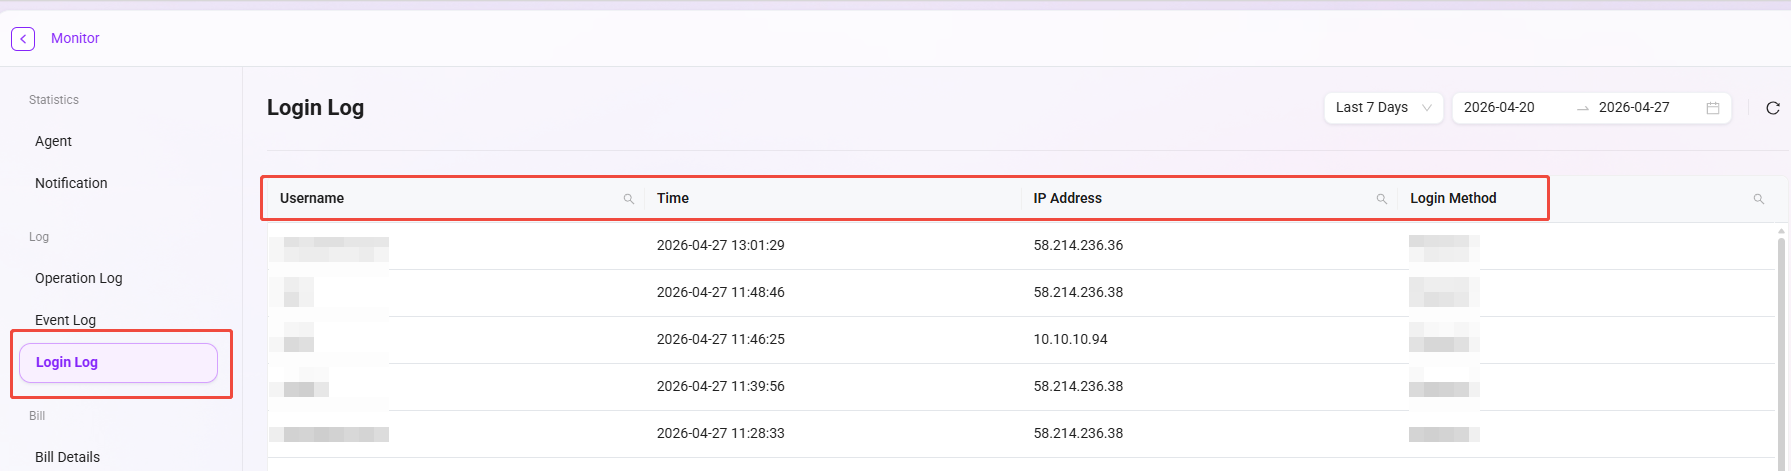
Login Logs
Login logs comprehensively record the authentication behavior of all users and serve as the foundation for security auditing and identifying abnormal logins.
Field Description
| Field Name | Field Function |
|---|---|
| Login username | Records the user account name for login attempts, supporting user behavior analysis |
| Login time | Records the specific time when the login occurred, used for time series analysis |
| Login IP address | Records the network address of the login source, supporting geolocation analysis and anomaly detection |
| Login method | Identifies the login authentication method (password, single sign-on, etc.), supporting security policy analysis |
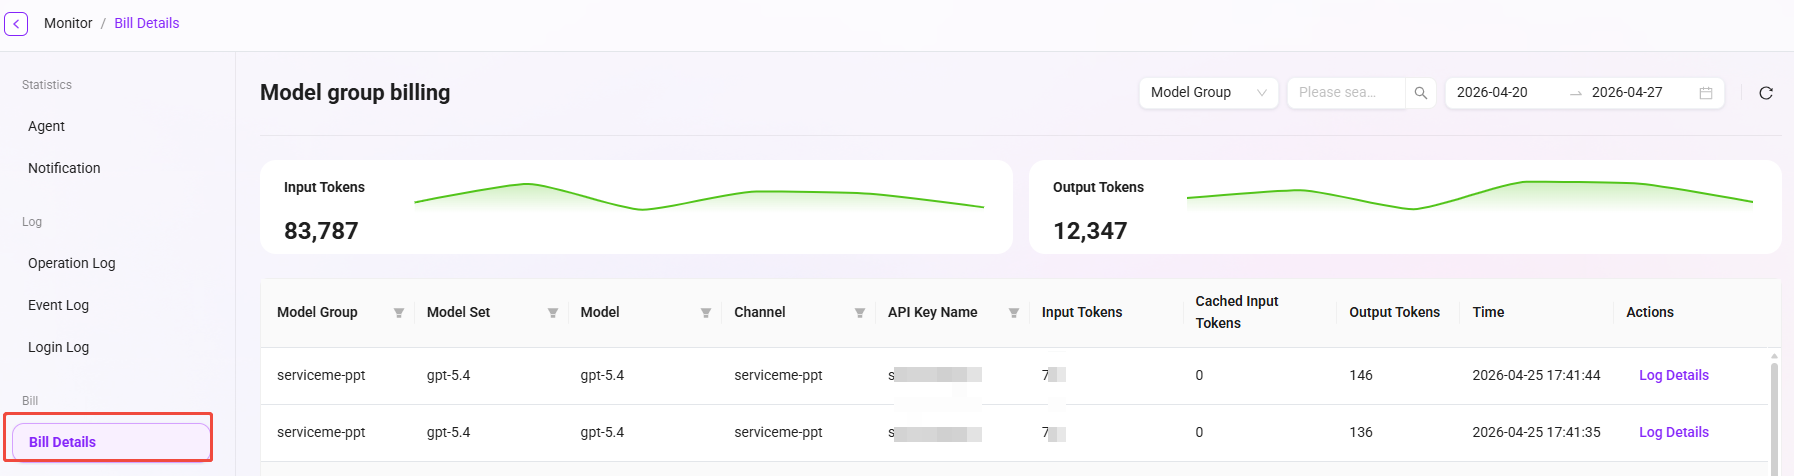
Billing Details
In the SERVICEME system, you can view the billing details of Token usage. The line chart at the top of the interface shows changes in Token-related values at different points in time, visually presenting usage trends. The table below records in detail the Token consumption and corresponding costs of various models within a specific time period, and lists related usage types and other information, making it easy to clearly understand the billing situation of each Token usage.
Information Provided on the Billing Details Page
The billing details interface allows you to view the following information:
- Model group: Displays the group category to which the model belongs.
- Model set: Indicates the collection name to which the model belongs.
- Model: Displays the specific model name used.
- Channel: Identifies the path through which the model runs.
- API Key name: Shows the name of the API key used to access the model.
- Input Token: Records the number of Tokens input into the model.
- Input token (cache hit): Displays the number of input Tokens when the cache is hit.
- Output token: Shows the number of Tokens consumed by the model output.
- Time: Records the specific time when the model operation occurred.
- Operation: Provides executable options such as viewing log details.
Purpose of Billing Details
- Cost transparency: Accurately track the cost generated by each model call, making costs visible, manageable, and controllable.
- Usage trend analysis: Identify resource consumption patterns through trend charts, providing data support for resource procurement and budget planning.
- Troubleshooting and optimization: Combine detailed logs to analyze the causes of high-cost requests, and then optimize prompts or business processes to control costs.
- Multi-dimensional allocation: Support allocating costs to different projects or departments through dimensions such as model, channel, and API Key.